NextDose: A web-based Bayesian dose
forecasting tool
Last updated 23 August 2024
Tacrolimus
Tacrolimus is widely used as an immunosuppressant after organ
transplantation. It is measured in whole blood with concentrations
approximately 100 times those in plasma (Sikma, Van Maarseveen et al. 2020). It has been recommended that whole blood concentrations be interpreted
by standardization to those expected with a haematocrit
of 45% (Storset, Holford et al. 2014a, Storset,
Holford et al. 2014b, Staatz, Størset et al. 2015).
Body size is best described using predicted fat free mass and theory
based allometric scaling. Concomitant steroid dosing markedly decreases
tacrolimus oral bioavailability (Storset, Holford et al. 2014b, Staatz,
Størset et al. 2015).
Understanding Concentrations
Tacrolimus
concentrations are measured in whole blood. Part of the reason for this is
convenience for the laboratory because concentrations in whole blood are about 20
to 60 times higher than in plasma depending on the haematocrit
(Figure 1).
The distribution
and elimination of drugs is determined by unbound concentration, and it is the
unbound concentration that determines both beneficial and adverse effects. These
principles are fundamental in describing and understanding pharmacokinetics and
pharmacodynamics. They apply equally to tacrolimus which then introduces
challenges in interpreting whole blood concentrations.
The pharmacokinetics
of tacrolimus have been described using a theory based approach to predict plasma
concentration under the assumption that unbound concentration is proportional to
plasma concentration (Storset,
Holford et al. 2014b). The plasma concentration is used
to predict whole blood concentration (erythrocyte bound + plasma) using a
saturable binding model (Jusko,
Piekoszewski et al. 1995).
The distribution
and elimination of tacrolimus is not affected by changes in erythrocyte binding
or changes in haematocrit. Literature reports that
claim changes in haematocrit are associated with
changes in clearance are misleading because tacrolimus elimination is not
affected by erythrocyte mass. The implementation of the theory-based PK model
in NextDose uses standardization of whole blood tacrolimus concentrations to a
standard value of 45% which means changes in PK parameters such as clearance
and volume of distribution will be reflected in the standardized whole blood
concentration without being confounded by changes in haematocrit
(Figure 1).
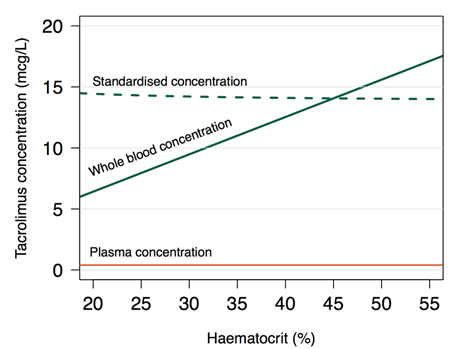
Figure 1 Tacrolimus concentration as a
function of haematocrit (HCT). Red line: Plasma concentration (Cp) (constant at
0.3 mcg/L). Green solid line: Whole blood concentration (Cwb)
calculated from literature values of binding to red blood cells: [Cwb = Cp + Cp × HCT (fraction) × Bmax
/ (Cp + Kd)], where Bmax=418
mcg/L erythrocytes and Kd=3.8 mcg/L plasma [35]. Green
dashed line: haematocrit-standardised concentration (Cstd)
(Cstd = Cwb × 45% / HCT%).(Storset, Holford et al. 2014b).
Because of
failure to understand these principles almost all research and clinical use of tacrolimus
concentrations is distorted by not recognizing the misleading consequences of
using un-standardized whole blood concentrations. This distortion continues
today (2024) despite the theory and clinical application of standardized
concentrations having been available since 2014.
Target Concentration
The use of
a trough concentration target is based on tradition but without pharmacological
support. The trough concentration is the lowest concentration during a steady
state dosing interval, but the pharmacological effects are determined by the full time course of concentrations which are necessarily all
higher than or equal to the trough concentration. A more pharmacologically
rational target that captures exposure to all the concentrations causing the
drug effect is the area under the concentration time curve (AUCssDI). Dividing
AUCssDI by the dosing interval (DI) is the average steady state concentration
(Cssavg). Cssavg is independent of the dosing interval and is thus a simple
choice for a target concentration based on pharmacological principles. Nevertheless,
this choice is still rather naïve because it does not account for the time
course of concentration and the delays in the concentration response
relationship but it clearly a step in the right direction away from the
traditional trough concentration.
By default,
NextDose suggests using Cssavg as the target concentration, rather than trough concentration. A CssAvg 15 mcg/L (HCT=45%) is
approximately equivalent to a trough concentration of 7 mcg/L (HCT=33%) (Storset,
Holford et al. 2014b).
There is no pharmacological reason to change the target depending on genotype. The CYP3A4 and CYP3A5 genotypes change exposure (AUCssDI) and thus the average concentration (Cssavg). They do not change the pharmacodynamics of tacrolimus.
NextDose will take care of the CL and F changes when estimating the Bayesian CL and F and use that to predict the dose needed to achieve the target.
A simulation based study compared covariate based dosing (fat free mass) with Bayesian target concentration adapted dosing. Bayesian dosing improved the day 5 Cssavg within an 80-125% acceptable range around the target concentration of 14.2 mcg/L from 37% to 65% (Storset, Holford et al. 2014b).
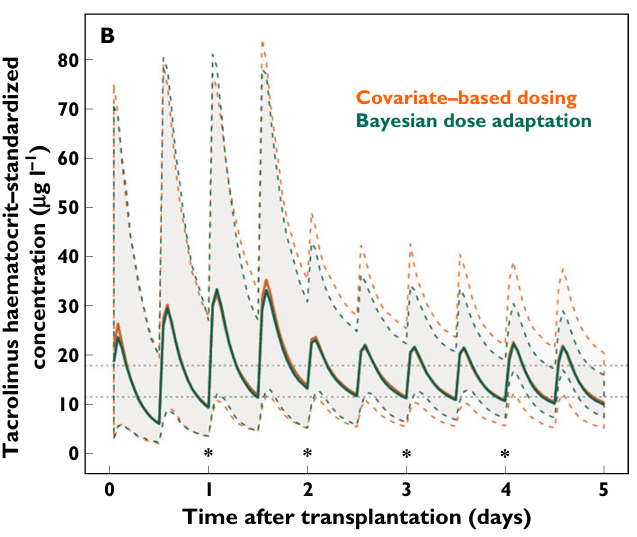
Tacrolimus trough
target concentration attainment was subsequently shown to be improved using
Bayesian forecasting and haematocrit based standardisation of whole
blood concentrations (Storset, Asberg
et al. 2015).
CYP3A4 and CYP3A5 Genotypes
In view of
increased interest in genotype based initial dosing of tacrolimus (Khatri,
Felmingham et al. 2024) two CYP3A4 genotypes are included
in NextDose (Figure 1).
Figure 2 NextDose genotypes showing the
CYP3A4 and CYP3A5 genotypes which are relevant to tacrolimus.
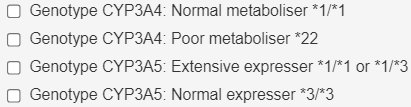
CYP3A4
normal metaboliser is *1/*1. CYP3A4 poor metaboliser is *22. CYP3a4 poor metabolisers
have a clearance 26% lower than normal metabolisers.
“Because of
the low number of CYP3A5 *1/*1 carriers in the dataset (n = 3), these subjects
were grouped with CYP3A5*1/*3 carriers(n=33) during covariate analysis. CLp was estimated to be 30% higher (ΔOFV −46.0,
P < 0.001) and F 18% lower (ΔOFV −2.9, P = 0.09) in this group
compared with patients not expressing functional CYP3A5 enzyme (*3/*3
carriers). Although an independent effect on F in addition to the effect on CLp was not statistically supported at the significance
level of 0.05 during covariate inclusion, effects on both parameters were
retained because both CLp and F should theoretically
be altered in patients with functional CYP3A5 enzyme in their liver and
intestines.” (Storset,
Holford et al. 2014b)
CYP3A5
normal expresser is *3/*3. CYP3A5 extensive expresser is *1/*1 or *1/*3. CYP3A5
expressers have a 30% increase of CL and 18% decrease in oral bioavailability.
Overall, these two effects of CYP3A5 increased expression decrease tacrolimus
exposure and are used predict the dose required to achieve the target
concentration.
Parameter Estimates and Covariate Effects
The
tacrolimus parameter estimates and covariate effects
are illustrated using data from a child who was given tacrolimus before and
after a kidney transplant. The transplant took place about 5 h after the first
concentration measurement (Figure 2).
Figure 3 Time course of predicted and
observed tacrolimus (HCTstd). Storset2024 model without early
transplant effect on oral bioavailability.
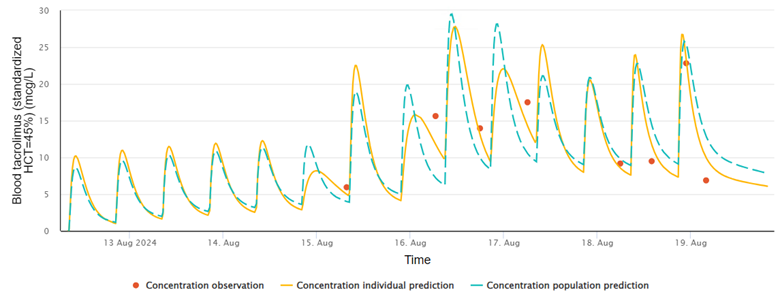
Table 1 Parameters and Covariate Effects.
Interpretation comments refer to values in Figure 3
|
Column |
Description |
Interpretation |
|
Time h |
Time of
observed concentration |
The first time
(71.63 h) is relative to the first dose of tacrolimus |
|
CL L/h |
Empirical
Bayes estimate of whole blood clearance with standard HCT of 45% |
The value
9.76 L/h reflects this is a child (adult value around 17 L/h) |
|
fCL% |
Fractional
difference from group* value for CL reflecting the random between subject
effect |
The
difference is small (1.4%) indicating the covariate effects are doing a good
job of predicting CL |
|
V L |
Empirical Bayes
estimate of whole blood volume of distribution with standard HCT of 45% |
The value
53.6 L/h reflects this is a child (adult value around 130 L/h) |
|
fV% |
Fractional
difference from group value for V reflecting the random between subject
effect |
The
difference is small (15.9%) indicating the covariate effects are doing a good
job of predicting V |
|
F |
Oral
apparent bioavailability fraction |
The values
less than 1 reflect predictable effects of prednisolone and CYP3A5 expresser
genotype as well as random between subject effects |
|
fF% |
Fractional
difference from group value for F reflecting the random between subject
effect |
The
differences are small to modest (0% to -29.8%) indicating the covariate
effects are doing a reasonable job at predicting F |
|
FFM kg |
Predicted
fat free mass based on total body mass, height, sex and postnatal age |
FFM is used
as the allometric mass for scaling CL and V |
|
RF |
Renal
function |
Not used in the
PK model but reflects improvement following transplant |
|
HCT% |
Observed haematocrit |
HCT is used
to standardize tacrolimus concentrations |
|
Days Post Tx |
Days
following the time of transplant. The -1 value means the observed
concentration was obtained prior to the transplant not days before
transplant. |
Value used
to predict early transplant increase in bioavailability when days are greater
than zero and less than 2 |
|
fTx
on F% |
Fractional
difference from group value for early transplant effect on bioavailability
reflecting the random between subject effect |
This value
is always 0 for the Storset 2024 model. It may be non-zero for the Storset
2024 B model from 0 to 2 days post-transplant. |
|
fCYP3A4 on
CL% |
Genotype
prediction of effect on clearance |
CL is
decreased for subject with a poor metaboliser
genotype |
|
fCYP3A5 on
CL% |
Genotype
prediction of effect on clearance |
CL is
increased for subject with an expresser genotype |
|
fCYP3A5 on
CL% |
Genotype
prediction of effect on bioavailability |
F is
decreased for subject with an expresser genotype |
|
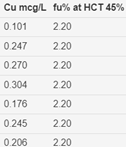
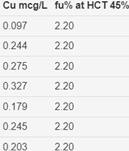
Cu mcg/L |
Individual
prediction of tacrolimus unbound concentration |
The Storset
model is based on predicted unbound plasma concentrations. The Kd is 3.8 mcg/L (Jusko, Piekoszewski et al. 1995). |
|
fu% at HCT
45% |
Individual
prediction of tacrolimus unbound percentage |
The fraction
unbound and observed HCT is used to predict whole blood concentrations for
comparison with observed whole blood concentrations. |
* The group
value is the parameter value after incorporating the predictable covariate
effects without any random effects. In older literature it might be called the
“typical value”.
Figure 4 Parameter estimates and covariate effects. Storset2024 model without early transplant effect on oral
bioavailability.
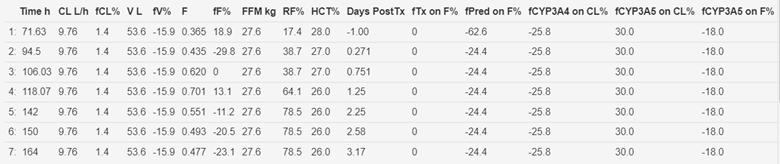
The
fractional early transplant effect on bioavailability (fTx
on F%) is zero because this effect is not included in the Storset2024 model.
See Figure 5
for results using the Storset2024 B model including transplant effects.
Figure 5 Time course of predicted and observed tacrolimus
(HCTstd). Storset2024 B model including early transplant effect on oral
bioavailability.
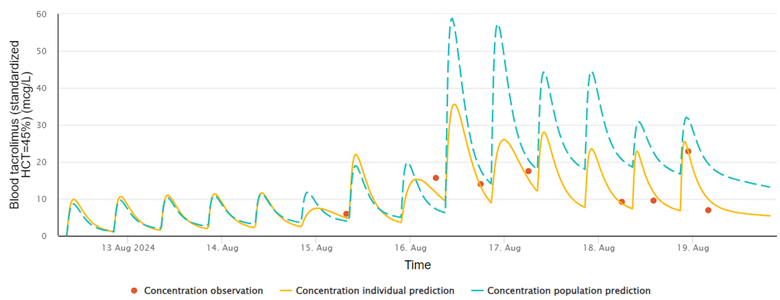
The
predicted increase in bioavailability in the 2 days following transplant is
reflected in the 4 high peak population concentrations. The individual
predictions are lower because of the estimated random effect for this subject.
Figure 6 Parameter estimates and covariate
effects. Storset2024 B model including
early transplant effect on oral bioavailability.
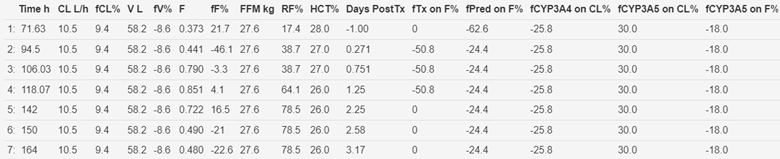
The group value
is a 2.68 fold increase in oral bioavailability between 0 and 2 days post-transplant
otherwise oral bioavailability has a nominal value of 1 (Storset,
Holford et al. 2014b). The Ftx
on F% value of minus 50.8% reflects the random between subject effect
indicating in this subject the bioavailability appears only to have increased
by about 36% (1- 0.508 x 2.68).
The Storset
2024 B model should be used with caution especially if there are no
concentrations measured in the immediate post-transplant period. The estimated
early transplant group effect on bioavailability is big with 57% between
subject variability. The Storset 2024 model without the early transplant effect
may be more reliable for interpretation of concentrations measured more than 2
days after the time of transplant.
References
Jusko, W. J., W. Piekoszewski, G. B. Klintmalm, M. S. Shaefer, M. F. Hebert, A. A. Piergies, C. C. Lee, P. Schechter and Q. A. Mekki (1995). "Pharmacokinetics of tacrolimus in liver transplant patients." Clin Pharmacol Ther 57(3): 281-290.
Khatri, D., B. Felmingham, C. Moore, S. Lazaraki, T. Stenta, L. Collier, D. A. Elliott, D. Metz and R. Conyers (2024). "Evaluating the evidence for genotype-informed Bayesian dosing of tacrolimus in children undergoing solid organ transplantation: A systematic literature review." British Journal of Clinical Pharmacology Early View(n/a).
Sikma, M. A., E. M. Van Maarseveen, C. C. Hunault, J. M. Moreno, E. A. Van de Graaf, J. H. Kirkels, M. C. Verhaar, J. C. Grutters, J. Kesecioglu, D. W. De Lange and A. D. R. Huitema (2020). "Unbound Plasma, Total Plasma, and Whole-Blood Tacrolimus Pharmacokinetics Early After Thoracic Organ Transplantation." Clinical Pharmacokinetics 59(6): 771-780.
Staatz, C. E., E. Størset, T. K. Bergmann, S. Hennig and N. Holford (2015). "Tacrolimus pharmacokinetics after kidney transplantation – Influence of changes in haematocrit and steroid dose." British Journal of Clinical Pharmacology: DOI: 10.1111/bcp.12729.
Storset, E., A. Asberg, M. Skauby, M. Neely, S. Bergan, S. Bremer and K. Midtvedt (2015). "Improved Tacrolimus Target Concentration Achievement Using Computerized Dosing in Renal Transplant Recipients--A Prospective, Randomized Study." Transplantation 99(10): 2158-2166.
Storset, E., N. Holford, S. Hennig, T. K. Bergmann, S. Bergan, S. Bremer, A. Asberg, K. Midtvedt and C. E. Staatz (2014b). "Improved prediction of tacrolimus concentrations early after kidney transplantation using theory-based pharmacokinetic modelling." Br J Clin Pharmacol 78(3): 509-523.
Storset, E., N. Holford, K. Midtvedt, S. Bremer, S. Bergan and A. Asberg (2014a). "Importance of hematocrit for a tacrolimus target concentration strategy." Eur J Clin Pharmacol 70(1): 65-77.
Copyright All rights reserved | Developed by Sam Holford & Nick
Holford 2012-2024