NextDose: A web-based Bayesian dose
forecasting tool
Last updated 16 June 2024
Individual Parameters and Covariates
NextDose estimates
pharmacokinetic (PK) and pharmacodynamic (PD) parameters using a Bayesian
method. These individual parameters are known as empirical Bayes estimates
(EBEs). The EBEs are used to individualize dose predictions and to predict the
time course of concentrations and biomarkers such as INR.
The EBEs are determined in
part by population parameters and in part by any observations that are
available. The population parameters describe a standard individual based on
patient factors such as total body mass (TBM) and renal function (e.g. TBM=70 kg,
renal function=1). These patient factors are known as covariates. Covariates
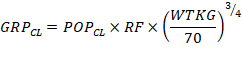
are used to predict a group parameter value using covariate effects. For
example, group clearance ![]() can be predicted from TBM and renal function
(RF and population clearance
can be predicted from TBM and renal function
(RF and population clearance ![]() by assuming clearance is linearly proportional
to RF and a theory based allometric function of TBM (Equation 1):
by assuming clearance is linearly proportional
to RF and a theory based allometric function of TBM (Equation 1):
|
|
Equation 1 |
RF is calculated from the
ratio of the estimated glomerular filtration rate (eGFR) calculated from serum
creatinine to the normal GFR (nGFR) predicted for an
individual of the same size and maturation with normal renal function. Note
that eGFR is the value for that individual without any scaling by body size or
body surface area. NextDose calculates eGFR based on the ratio of creatinine
production rate (CPR) to steady state Scr. CPR is predicted using a model
developed from observed GFR data (Rhodin,
Anderson et al. 2009). This model uses fat free mass,
post-menstrual age and sex to calculate CPR relative to a 70 kg, 176 cm, 20 y
old adult male. When a series of Scr measurements are
available the Scr time course is used to predict CLcr without assuming steady
state. Further details can be found in (O'Hanlon,
Holford et al. 2023, Holford, O'Hanlon et al. 2024)
Note that Equation 1 is
usually an over-simplification by assuming that clearance is entirely
proportional to RF. Even for drugs that are thought to be almost completely
renally eliminated (such as gentamicin) a substantial part of the observable
clearance is not predictable from creatinine clearance (Matthews,
Kirkpatrick et al. 2004). This observation has been extended
to identify two components of renal clearance – one component limited by GFR,
Both components are linked to RF as shown in Equation
2 and Equation 3 (Holford, O'Hanlon et al. 2024).
|
|
Equation
2 |

An asymmetrical sigmoid
function was used to describe the relationship between RF and CLGFR using drug
specific parameters, CLGFR_RF50, Hill_LT and Hill_GE. The sigmoidicity
parameter in Equation
2 has a different value depending on whether RF is less than (Hill_LT) or greater than or equal (Hill_GE)
to CLGFR_RF50.
The
second component of clearance. CLNGFR, is not linked to GFR (Equation 3).
|
|
Equation
3 |
CLNGFRpop is a drug specific population
parameter estimate for CLNGFR which is directly proportional to RF. Additional
factors include allometric scaling for size (FsizeNGFR,
using normal fat mass, and maturation based on post-menstrual age, Fmat,PMANGFR, and on postnatal
transition, Fmat,PNANGFR.
The group clearance for
extensively renally eliminated drugs such as gentamicin, tobramycin, amikacin
and vancomycin is calculated using Equation 4
|
|
Equation 4 |
Individual estimates (EBEs)
of the parameter are then predicted from the group parameter value and an
individual specific random effect. This random effect is made up of a between
subject variability component (BSV) and a within subject variability component
(WSV). The within subject variability is usually estimated with reference to an
interval known as an occasion and WSV is therefore commonly described as
between occasion variability (BOV). The definition of an occasion in NextDose
is a dosing interval which includes one or more observations.
Random effects are commonly
assumed to be log-normally distributed so that the individual clearance is
predicted using Equation 5:
|
|
Equation 5 |
NextDose Predictions of Doses, Individual
Parameters and Calculated Covariates
Figure 1 shows the
concentration predictions in a patient treated with vancomycin who had four
concentration observations after the first dose and a pre-dose concentration
observation after 6 doses.
Figure 1

The
Bayesian dose predictions for these 2 dosing occasions with vancomycin
observations are shown in Figure 2
Figure 2
NextDose TCI vancomycin holfordGAV2023_AVG
Target: AUC 400 mg/L*h
per 24 hours ( Css avg 16.7
mg/L )
|
Trapezoid |
AUC |
Units |
Interval |
Dose Pred |
|
1 |
139 |
mg/L*h |
0-infinity |
maintenance dose 2878 mg |
|
Bayesian |
Route |
Predicted Dose |
Actual Dose |
Latest Obs |
|
1 |
IV |
1614 mg every 1 day |
1000 mg |
2019/02/24 15:59 |
|
2 |
IV |
1614 mg every 1 day |
1000 mg |
2019/02/27 07:59 |
Proposed IV maintenance dose 807 mg every 12 hours (Average)
Following the dose
predictions is a table of individual parameters (EBEs) and calculated
covariates (Table 1). NextDose shows 8 values which are displayed for
all medicines.
Table 1 Empirical Bayes Parameters and %
difference from group values for this patient
|
Time h |
CL L/h |
fCL% |
V L |
fV% |
F |
fF% |
FFM kg |
RF% |
|
1:
7.98 |
4.04 |
78.3 |
31.9 |
0 |
1 |
0 |
54.5 |
43.1 |
|
2:
71.98 |
4.03 |
77.8 |
31.9 |
0 |
1 |
0 |
54.5 |
43.1 |
The first 6 describe the
parameters clearance (CL), central volume of distribution (V) and
bioavailability (F). Following the EBE for each parameter is the fractional
difference (f) from the group parameter value expressed as a percentage. When a
medicine is given parenterally then F is 1 and there is no random effect.
The last 2
standard values are calculated fat free mass (FFM) and renal function (RF). RF
is expressed as a percentage where 100% means normal renal function relative to
predicted normal glomerular filtration rate. FFM is used to predict the effect
of body size and composition on clearance, volume of distribution and
glomerular filtration rate. RF is used to predict components of clearance that
are related to RF.
Gentamicin, amikacin and vancomycin
Some
additional medicine specific values relating to renal function are shown with
gentamicin, tobramycin, amikacin and vancomycin predictions. Table 2 shows an
example for vancomycin.
Table 2
|
CLcr L/h |
Normal GFR L/h |
CPR uM/h |
RFss% |
CLcrss L/h |
CPRss uM/h |
|
2.94 |
6.81 |
312 |
55.9 |
3.52 |
373 |
|
2.94 |
6.81 |
312 |
55.9 |
3.52 |
373 |
The first (CLcr) is the
predicted creatinine clearance which takes into account
the time course of change in serum creatinine (Scr) in order to predict the
steady state Scr. The next 2 values are the predicted normal glomerular
filtration rate (normal GFR) and creatinine production rate (CPR) (O'Hanlon,
Holford et al. 2023).
The last 3 values are
predictions of RF, CLcr and CPR using methods for CLcr that assume the measured
SCr is at steady state (Schwartz 1992,
Matthews, Kirkpatrick et al. 2004)
Busulfan
There are
no medicine specific values shown for busulfan.
|
CL L/h |
fCL% |
V L |
fV% |
F |
fF% |
FFM kg |
RF% |
|
10.8 |
36.7 |
7.94 |
-8.7 |
1 |
0 |
36.5 |
. |
Methotrexate
Methotrexate
has medicine specific values for observed urine pH and predicted CLcr
|
CL L/h |
fCL% |
V L |
fV% |
F |
fF% |
FFM kg |
RF% |
Urine pH |
CLcr L/h |
|
7.77 |
-68.1 |
41.2 |
-73.6 |
1 |
0 |
55.9 |
73.2 |
7.00 |
5.60 |
|
9.25 |
-62.1 |
48.4 |
-69 |
1 |
0 |
55.9 |
73.2 |
7.00 |
5.60 |
Tacrolimus
There are 6
specific values for tacrolimus. Oral bioavailability is high during the first 2
days after transplant and fall to normal after day 2
(day of transplant is day 0). There is a BSV random effect on bioavailability upto day 2 which is 63% lower than
expected. The daily dose of prednisolone (Pred) affects oral bioavailability
and in this case F is 75.6% of F without a steroid
effect. The CYP3A5 genotype can affect both F and CL. In this case there is no
genotype effect. The haematocrit influences the
measured whole blood value of tacrolimus so its value
(HCT) is shown here. Finally the predicted plasma to
blood fraction (fu) expressed as a percentage 2.09% at a standardized blood
concentration (HCT=45%) is shown.
|
CL L/h |
fCL% |
V L |
fV% |
F |
fF% |
FFM kg |
RF% |
|
9.09 |
-52.3 |
43.3 |
-71.9 |
0.720 |
-4.8 |
70.4 |
. |
|
9.09 |
-52.3 |
43.3 |
-71.9 |
0.841 |
11.2 |
70.4 |
. |
|
Day Tx on F |
diffDTx F% |
Pred on F % |
GT CYP3A5 on F % |
GT CYP3A5 on CL % |
HCT % |
fu% at HCT 45% |
|
1 |
-62.687 |
75.6 |
100 |
100 |
29.0 |
2.09 |
|
1 |
-62.687 |
75.6 |
100 |
100 |
29.0 |
2.09 |
Linezolid
Linezolid
has 2 specific values. The first is the minimum inhibitory concentration (MIC,
2 mg/L). The second is the baseline platelet count (PLT0, cells/microL).
There is a
marked decrease in RF with a decrease in CL. Nephrotoxicity is a well known adverse effect of
linezolid.
|
CL L/h |
fCL% |
V L |
fV% |
F |
fF% |
FFM kg |
RF% |
MIC |
PLT0 |
|
1.31 |
-47.6 |
10.2 |
-45.4 |
1 |
0 |
46.7 |
23.4 |
2.00 |
212000 |
|
1.31 |
-47.6 |
10.2 |
-45.4 |
1 |
0 |
46.7 |
23.4 |
2.00 |
212000 |
|
1.29 |
-47.6 |
10.2 |
-45.4 |
1 |
0 |
46.7 |
20.7 |
2.00 |
212000 |
|
1.29 |
-47.6 |
10.2 |
-45.4 |
1 |
0 |
46.7 |
20.7 |
2.00 |
212000 |
|
1.26 |
-47.6 |
10.2 |
-45.4 |
1 |
0 |
46.7 |
15.3 |
2.00 |
212000 |
|
1.25 |
-47.6 |
10.2 |
-45.4 |
1 |
0 |
46.7 |
13.3 |
2.00 |
212000 |
|
1.24 |
-47.6 |
10.2 |
-45.4 |
1 |
0 |
46.7 |
13 |
2.00 |
212000 |
|
1.24 |
-47.6 |
10.2 |
-45.4 |
1 |
0 |
46.7 |
12.3 |
2.00 |
212000 |
Voriconazole
|
CL L/h |
fCL% |
V L |
fV% |
F |
fF% |
FFM kg |
RF% |
|
2.19 |
-33.3 |
66.9 |
-5 |
1 |
0 |
42.5 |
. |
There are
many covariates that affect voriconazole PK. Ritonavir (RTV), St John’s Wort
(SJW), prednisolone (or prednisone) (Pred), methyl prednisolone (MePRed), dexamethasone (DEX). Phenytoin (PHE) and
rifampicin (RIF) are both inducing agents. The CYP2C19 genotype may be
associated with a reduced F (87.7% of normal) and CL (56.3% of normal). The
minimum inhibitory concentration (MIC, mg/L) is also shown.
|
RTV |
SJW |
Pred |
MePred |
DEX |
PHE or RIF |
GT CYP2C19 on F % |
GT CYP2C19 on CL % |
MIC mg/L |
|
0 |
0 |
0 |
0 |
0 |
0 |
87.8 |
56.3 |
1 |
Warfarin
The
warfarin model estimates both PK and PD parameters.
|
CL L/h |
fCL% |
V L |
fV% |
F |
fF% |
FFM kg |
RF% |
|
0.141 |
-4.8 |
29.8 |
-0.9 |
1 |
0 |
66.0 |
. |
The predicted baseline prothrombin complex activity (PCA0) is shown here
as 97.9% of normal. The PCA half life (T2PCA) EBE is
11.5 h which is just under 0.5% higher than the group value (fT2PC%). The
potency of the S-enantiomer of warfarin for inhibition of PCA synthesis is
0.211 mg/L (C50 S) and is -6.39% of the group value (fC50%). The exponent for
the warfarin inhibition model is 2.75 (Hill) and this is 1.52% higher than the
group value. The potency of the R-enantiomer of warfarin as an inhibitor of
S-warfarin is 2.4 mg/L. The VKORC1 genotype affects the S-warfarin C50 so that
it is 0.766 of normal. The CYP2C9 genotype effect on S-warfarin clearance is
negligible with a fractional increase of 0.01.
|
PCA0 % |
T2PCA h |
fT2PC% |
C50S mg/L |
fC50% |
Hill |
fHill% |
C50R mg/L |
FGT VKOR on C50 |
FGT CYP2C9 on CLs |
|
97.9 |
11.5 |
0.469 |
0.211 |
-6.393 |
2.75 |
1.52 |
2.40 |
0.766 |
1.01 |
Mycophenolate
Mycophenlate unbound clearance increases substantially
after a renal transplant (from 757 L/h to 1229 L/h over 1 month).
|
CL L/h |
fCL% |
V L |
fV% |
F |
fF% |
FFM kg |
RF% |
ALB g/L |
fu MPA % |
|
757 |
-27.4 |
3263 |
7.7 |
0.950 |
0 |
66.1 |
14.7 |
32.0 |
1.66 |
|
750 |
-28.1 |
3078 |
1.6 |
0.950 |
0 |
66.1 |
14.7 |
32.0 |
1.66 |
|
1449 |
-33.3 |
3264 |
7.8 |
0.950 |
0 |
66.1 |
14.7 |
31.0 |
1.71 |
|
1576 |
-27.4 |
3995 |
31.9 |
0.950 |
0 |
66.1 |
14.7 |
31.0 |
1.76 |
|
1229 |
-43.4 |
2947 |
-2.7 |
0.950 |
0 |
66.1 |
14.7 |
33.0 |
1.38 |
Both albumin and renal function influence mycophenolate plasma protein
binding. The serum albumin (ALB, g/L) is shown along with RF. The unbound
fraction of mycophenolate (unbound/total plasma) decreased from 1.66% to 1.38%
in the month after transplant.
Caffeine
Caffeine is
used in premature neonates to reduce the risk of apnea of prematurity
|
CL L/h |
fCL% |
V L |
fV% |
F |
fF% |
FFM kg |
RF% |
|
0.008 |
-0.9 |
1.71 |
19.7 |
1 |
0 |
1.22 |
. |
The number of days after birth (post-natal age, PNA) for this neonate is
0. Height (HT) is 40 cm. The allometric fraction of size affecting CL relative
to a 70 kg adult is 0.05. The fractional maturation of non-renal function CL is
0.025 while the fractional maturation of renal clearance is 0.171 (relative to
adult). The birth method was vaginal (0) rather than Caesarian (1).
|
PNA days |
HT cm |
FSIZCL |
FMAT CLnrf |
FMAT CLrf |
BIRTH V=0 C=1 |
|
0 |
40.0 |
0.050 |
0.025 |
0.171 |
0 |
Hydroxychloroquine
Hydroxychloroquine is used for the treatment of lupus erythematosus and
rheumatoid arthritis. Whole blood pharmacokinetics are described based on a
standard hematocrit (HCT) of 45%.
|
CL L/h |
fCL% |
V L |
fV% |
F |
fF% |
FFM kg |
RF% |
BMI kg/m^2 |
ALB g/L |
HCT % |
VENT |
|
11.6 |
25.2 |
777 |
5.7 |
0.746 |
0 |
63.2 |
52.7 |
26.8 |
35.0 |
45.0 |
1 |
|
11.6 |
25.2 |
777 |
5.7 |
0.746 |
0 |
63.2 |
52.7 |
26.8 |
35.0 |
45.0 |
1 |
|
11.6 |
25.2 |
777 |
5.7 |
0.746 |
0 |
63.2 |
52.7 |
26.8 |
35.0 |
45.0 |
1 |
Body mass index (BMI), serum albumin (ALB), haematocrit
(HCT) and use of artificial ventilation (0=no ventilator, 1=ventilator) are the
medicine specific factors.
Dabigatran
The RE-LY
2011 PK model (Liesenfeld, T.
et al. 2011) has random effects on V and F but
not on CL so fCL % is always zero.
|
CL L/h |
fCL% |
V L |
fV% |
F |
fF% |
FFM kg |
RF% |
|
66.0 |
0 |
698 |
-0.8 |
1.08 |
8.1 |
62.8 |
43.8 |
CLcr, Normal GFR, CPR, RFss%, CLcrss, CPRss have the same
meaning as described for gentamicin, amikacin and vancomycin.
The RE-LY 2011 PK model predicts CL with a sigmoid Emax model using CLcrss. The fractional effect of CLcrss
(F CLcrss CL) is relative to the size scaled
asymptotic CL (infinite CLcrss). The combined effects
of three concomitant medications (proton pump inhibitors, amiodarone,
verapamil) on bioavailability (F) is expressed as the % difference from no
concomitant medication effect.
|
CLcr L/h |
Normal GFR L/h |
CPR uM/h |
RFss% |
CLcrss L/h |
CPRss uM/h |
F CLcrss CL |
F ConMed F1 % |
|
3.32 |
7.57 |
308 |
50.5 |
3.56 |
331 |
0.514 |
0 |
Holford, N., C. J. O'Hanlon, K. Allegaert, B. Anderson, A. Falcão, N.
Simon, Y.-L. Lo, A. H. Thomson, C. M. Sherwin, E. Jacqz-Aigrain, C.
Llanos-Paez, S. Hennig, L. Mockus and C. Kirkpatrick (2024). "A
physiological approach to renal clearance: From premature neonates to
adults." British Journal of Clinical Pharmacology 90(4): 1066-1080.
Liesenfeld,
K.-H., L. T., C. Dansirikul, P. A. Reilly, S. J.
Connolly, M. D. Ezekowitz, S. Yusuf, L. Wallentin, S.
Haertter and A. Staab (2011). "Population
pharmacokinetic analysis of the oral thrombin inhibitor dabigatran etexilate in patients with non-valvular atrial fibrillation
from the RE-LY trial." Journal of Thrombosis and Haemostasis
9(11): 2168-2175.
Matthews,
I., C. Kirkpatrick and N. Holford (2004). "Quantitative justification for
target concentration intervention--parameter variability and predictive
performance using population pharmacokinetic models for aminoglycosides."
Br J Clin Pharmacol 58(1): 8-19.
O'Hanlon,
C. J., N. Holford, A. Sumpter and H. S. Al-Sallami (2023). "Consistent
Methods for Fat Free Mass, Creatinine Clearance and Glomerular Filtration Rate
to describe Renal Function from Neonates to Adults." CPT Pharmacometrics
Syst Pharmacol 12: 401-412.
Rhodin, M.
M., B. J. Anderson, A. M. Peters, M. G. Coulthard, B. Wilkins, M. Cole, E.
Chatelut, A. Grubb, G. J. Veal, M. J. Keir and N. H. Holford (2009).
"Human renal function maturation: a quantitative description using weight
and postmenstrual age." Pediatr Nephrol 24(1):
67-76.
Schwartz,
G. J. (1992). "Does kL/PCr
estimate GFR, or does GFR determine k?" Pediatr
Nephrol 6(6): 512-515.
Copyright All rights reserved | Developed by Sam Holford & Nick
Holford 2012-2024